All posts by Fawcs

The author is working as an IT-Systems Engineer for an Austrian company and has spezialiced on Linux (RHEL), Deployment and Monitoring but is also working with VMware, Windows, Cisco, ...

MIkrotik packet loss (Ping <70%)

Today I experienced an interesting story with my Mikrotik router at home. While updating the PiHole instance the system hat quite some problems obtaining either system updates but also the PiHole update packages. A ping on 9.9.9.9 showed that the Raspberry – on which the PiHole was hosted – had somewhat between 70-80% packet loss. Pinging the same IP from a Windows machine resulted in 0% packet.

All this happened only on wired connections but did not cause any problmes when connected via wifi.

As the Raspberry is directly attached to the Mikrotik router I also tried to connect it via a switch in between as that’s the setup for the windows machine. Same behavior.
Running pings from 3 Linux systems in the network and two Windows systems (even with exchanging network connections to be directly connected to the Mikrotik and connecting through the switch) came up with an interesting result:
All Windows machines had hardly any packet loss in 10 mins (<3%) and all the Linux systems had somewhat between 70%-80% packet loss (tested with a ping).
Any ping that involved the Mikrotik routers L2 functionality seemed to result in packet loss on the Linux machines.
Pinging any other machine on the same subnet worked without problems, but as soon as there was one hob in between the problem occurred.

Interestingly the problem vanished as far as the Torch tool was activated and no more packet loss occurred on any of the systems.

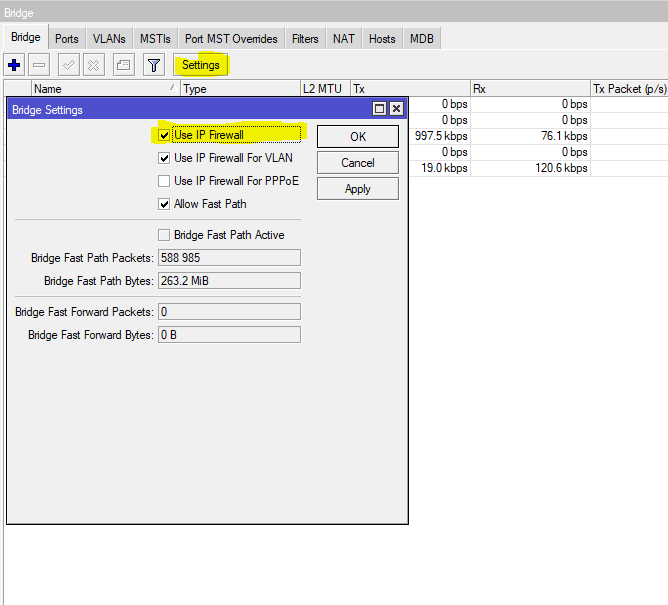
After some additional troubleshooting time (and disabling nearly all Mikrotik-configuration -> Firewall-Rules/Interfaces) the problem seemed to be with the Bridge interface used. It seems that the deactivation of the IP Firewall for the bridge interface caused the problem. After enabling it the behavior vanished and all systems no longer had any packet loss issues.

[admin@MikroTik] /interface bridge settings> /interface bridge settings 
[admin@MikroTik] /interface bridge settings> set use-ip-firewall yes    

Monitoring Tasmota with Zabbix

The repository contains a python-script which can be used to subscribe to an MQTT-server (e.q. mosquitto) and forward all MQTT-message to Zabbix. There the Template can be used to monitore the values sent via MQTT. Currently the Template is mainly intended as an example and requires adaption to your current setup/configuration of tasmote.

https://gitlab.com/fawcs/zabbix_tasmota_mqtt

CVSS-Regex

Just a little regex to validate CVSSvector strings

^CVSS\:\d\.\d\/AV\:[N,A,L,P]\/AC\:[L,H]\/PR\:[N,L,H]\/UI\:[N,R]\/S\:[U,C]\/C\:[N,L,H]\/I\:[N,L,H]\/A\:[N,L,H]$

Additional JS-Scripts for CVSS-cacluation:

https://www.first.org/cvss/v3.1/use-design

Batch import beats dashboards

cd /usr/share/
for BEAT in $(ls | grep -e "beat$"); do
echo -e "\e[92mBEAT: $BEAT\e[0m"
./$BEAT/bin/$BEAT setup --pipelines -c /etc/$BEAT/$BEAT.yml.* -path.home /usr/share/$BEAT/
./$BEAT/bin/$BEAT setup --dashboards -c /etc/$BEAT/$BEAT.yml.* -path.home /usr/share/$BEAT/
done

Zabbix SELinux policy generation

Commands to query the auditlog for Zabbix relevant queries and create/import a compiled policy file within Zabbix

Could be adapted to generate policies for any other system.

The suggestion is to set SELinux to permissive (setenforce=0) execute the action and afterwards create the policy based on the logged events. If the policy does not work on the first try after re-enabeling SELinux again it it could happen that a call was blocked (which is also logged within the auditlog) that was not blocked with SELinux in permissive mode. Therefore it could help creating a new human readable policy (.te-file) and checking the first version vs. the second version + merging them. 

filename=zabbix-server
cat /var/log/audit/audit.log  | grep zabbix | audit2allow -m $filename >> $filename.te
checkmodule -M -m -o $filename.mod $filename.te
semodule_package -o $filename.pp -m $filename.mod
semodule -i $filename.pp
 
 
#restorecon -R -v /run/zabbix/zabbix_server_alerter.sock    #suggested by the policygenerator

Ansible handlers (within roles) – run multiple tasks

Sometimes it could happen that we want to run multiple tasks after configuration file has changed instead of just one.

My specific usecase is, that I’m having a role that configures a SSL-certificate and additional SSL settings for an Apache webserver which could run standalone on a server or as a pacemaker resource.

If it is running directly on the server it’s quite simple and a handler is sufficient to restart the Apache service after the role ran through. In case the Apache is running as a pacemaker resource the resource should be restarted instead of the whole service to make sure pacemaker does not get confused. Therefore it is necessary to first check if we have the service running as a pacemaker resource first and execute the corresponding task afterwards so a single task (within our handler) is not sufficient.
Using the block statement will also not lead to success but fail with : ERROR! The requested handler 'Apply Apache Config' was not found in either the main handlers list nor in the listening handlers list

My approach to tackle this issue was to “missuse” the handler to only set a variable if something changed.
At the end of the role I’m checking if the variable is ture and if so, I’m including/executing my “handler-block”.

defaults/main.yml

common_linux_zabbix_server_web_ssl_path_private_apply_apache_config: no

handlers/main.yml

---
# handlers file for common_linux_zabbix_server_web_certificate

#set a fact which is checked at the end of the role-tasks
- name: "Apply Apache Config"
  set_fact:
    common_linux_zabbix_server_web_ssl_path_private_apply_apache_config: yes

tasks/main.yml

---
...
all your other tasks are executed before these following tasks
...


# workaround to run multiple tasks within a handler -> run the handlers if any of the above tasks did change something to notify the handler
- meta: flush_handlers

- name: "Run multiple tasks as a handler"
  include_tasks: ./restart_apache_resource_or_service.yml

tasks/restart_apache_resource_or_service.yml


---
- name: "Check if cluster resource exists"
  shell: "pcs resource | grep zbx_srv_httpd"
  ignore_errors: yes
  register: check

- name: "Restart cluster resource:"
  shell: "pcs resource restart zbx_srv_httpd"
  register: resource_restart
  when: check.rc == 0

- fail:
    msg: "An error occured when restarting the cluster resurce!"
  when: resource_restart.rc != 0

#Just restart the httpd service if no cluster resource was found
- name: "Restart httpd service"
  service:
    name: "httpd"
    state: restarted
  when: check.rc != 0[

HTTP to Pioneer SC-55 IP Interface

Pioneers AV receivers support network control over a proprietary protocol (SC-55 IP) that used a raw IP connection to the AV receivers port 8102.

This provides the possibility to easily control the AV receiver from the smartphone with tools like Tasker to automatically turn on the AV receiver, switch to the Bluetooth adapter, connect to the receiver and play music just by pressing one button instead of fiddling around for a minute will everything is working.
However, Tasker itself does not support RAW IP connections and in my experience the Send/Except-Plugin which could be used for sending the commands to the receiver, isn’t as stable as I’d wish that it was.

So I wrote a little flask restful application that works as a HTTP to RAW Pioneer gateway.
The script is hosted on a little Raspberry Pi that runs 24/7 and forwards the commands to the AV receiver.

The Script itself is hosted in the following repository:
https://gitlab.com/weixeflo/pioneer-sc-55-ip-via-rest-gw

To allow the receiver to be woken up when powered of it is necessary to enable the “Network Standy Mode”

Tasmota/Platformio error when compiling Tasmota for ESP8266 (firmware.elf section `.text’ will not fit in region `iram1_0_seg’ )

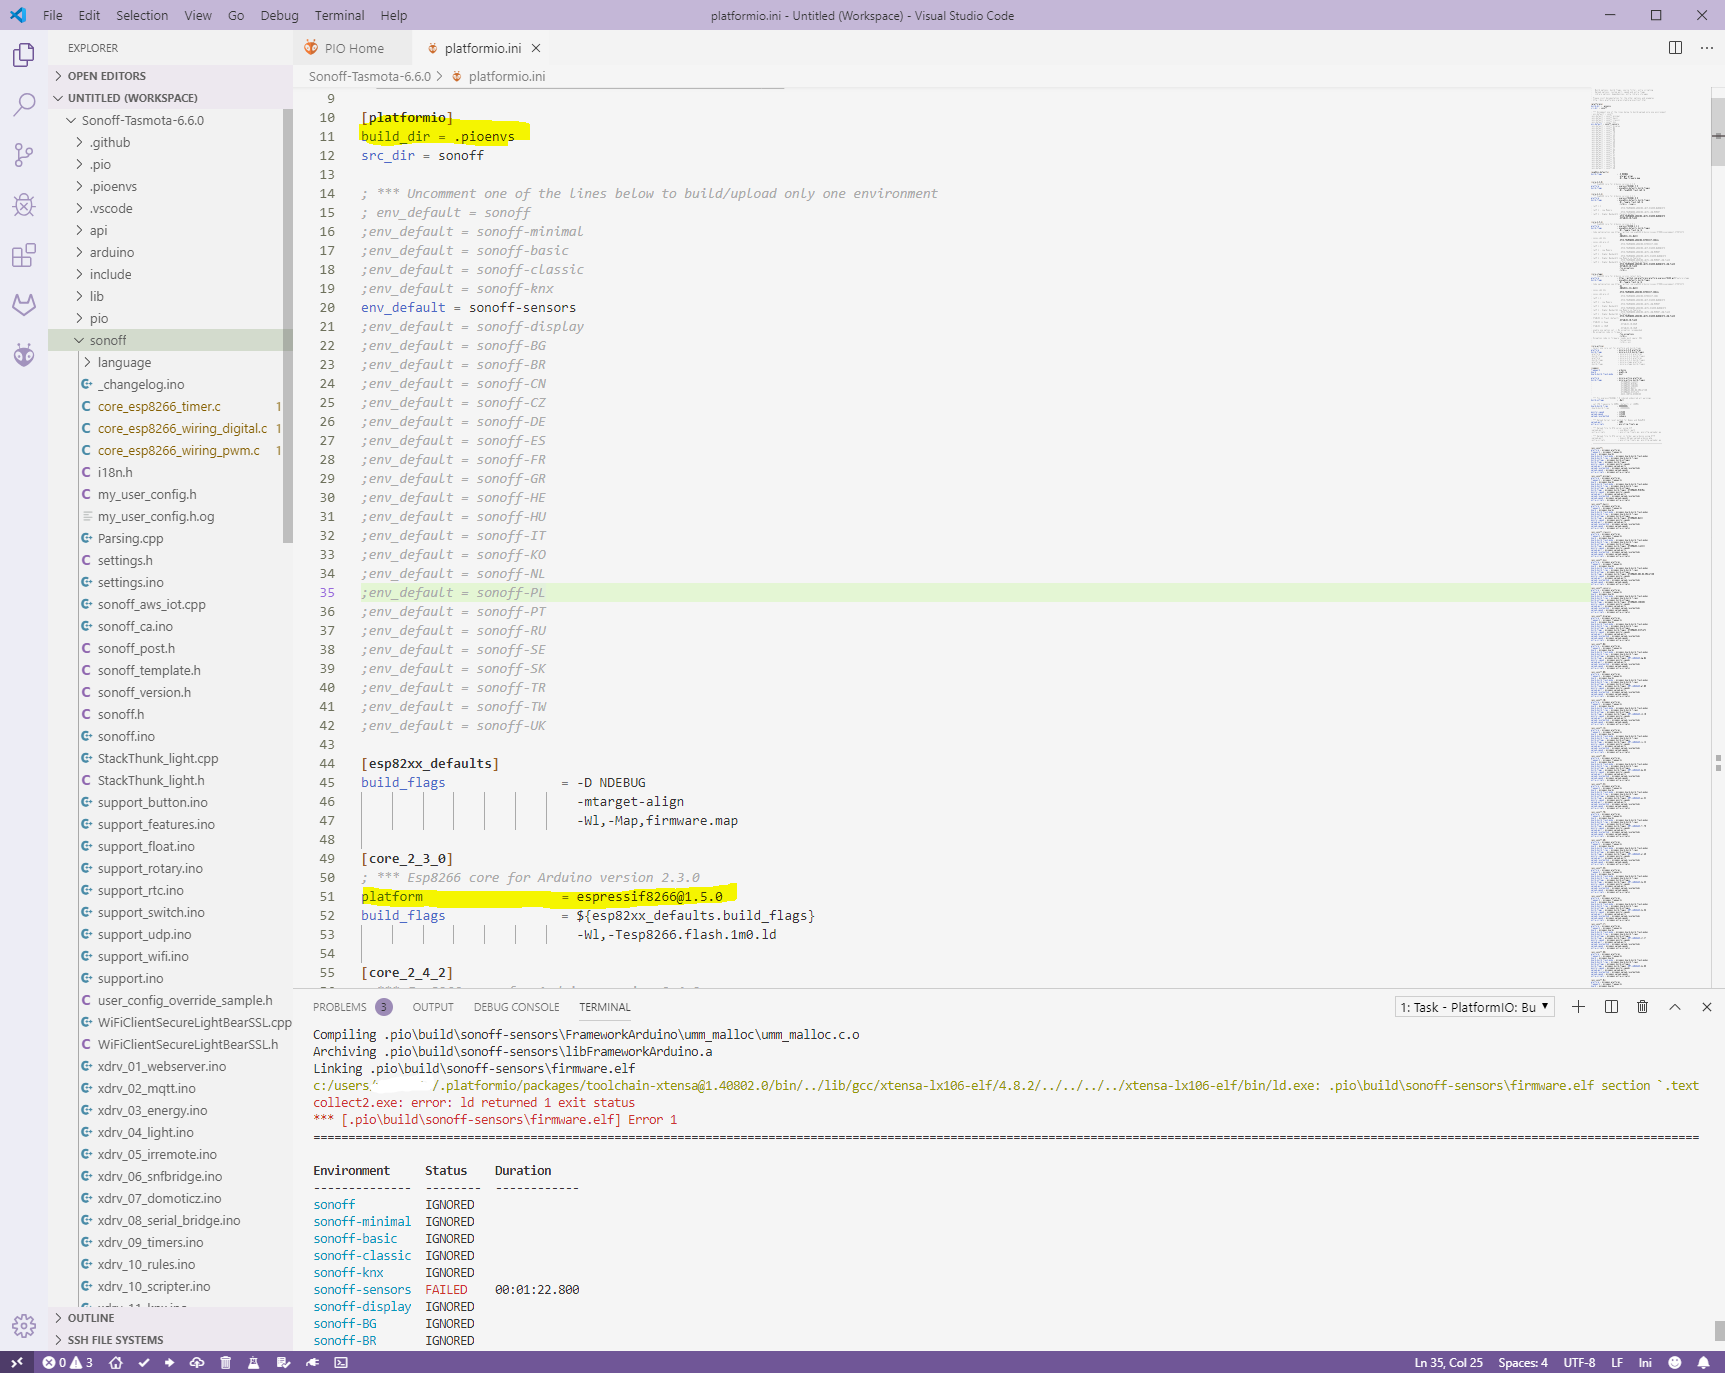
After changing my Tasmota ESP8266-dev environment to Visual Studio Code I ran into the problem that I always got the following error when trying to recompile my customized Tasmota firmware:

c:/users/username/.platformio/packages/toolchain-xtensa@1.40802.0/bin/../lib/gcc/xtensa-lx106-elf/4.8.2/../../../../xtensa-lx106-elf/bin/ld.exe: .pio\build\sonoff-sensors\firmware.elf section `.text' will not fit in region `iram1_0_seg'
collect2.exe: error: ld returned 1 exit status
*** [.pio\build\sonoff-sensors\firmware.elf] Error 1

Seems the problem is introduced by the updated Platformio 4 environemnt which ships some updated libraries that do not comply to the ESP-requirements. To work with Platformio 4 it is necessary to adapt the platformio.ini to match the following configuration:

[platformio]
build_dir = .pioenvs

[env:myesp8266env]
platform = espressif8266@1.5.0
... 
platformio.ini configuration file

https://github.com/platformio/platform-espressif8266/releases/tag/v1.5.0

Discussion on the Github bugtracker for the Tasmota project:
https://github.com/arendst/Sonoff-Tasmota/issues/6073#issuecomment-511111038

Get CVE information from NIST NVD and RHEL

Just two littel scripts that come handy if you want to download all the CVE info in JSON format for offline use.

[pastacode lang=”bash” manual=”%23!%2Fbin%2Fbash%0Aurls%3D%24(curl%20https%3A%2F%2Fnvd.nist.gov%2Fvuln%2Fdata-feeds%23JSON_FEED%20%7C%20grep%20’https%3A%2F%2F’%20%7C%20grep%20-i%20json.gz%20%7C%20sed%20’s%2F.*href%3D%2F%2Fg’%20%7C%20cut%20-d%5C’%20%20-f2)%0A%0Amkdir%20-p%20.%2FnistNvdJson%0Acd%20nistNvdJson%0Afor%20l%20in%20%24urls%3B%0Ado%0Awget%20%24l%0Adone%0Agunzip%20*%0A” message=”Donwload NIST NVD CVEs in JSON” highlight=”” provider=”manual”/]


[pastacode lang=”bash” manual=”%23!%2Fbin%2Fbash%0A%0A%0AloopVar%3D1%0AdataDir%3D%22rhelCveData%22%0Amkdir%20%24dataDir%20-p%0Aecho%20%22getting%20data%3A%22%0AT%3D%22%24(date%20%2B%25s)%22%0Awhile%20%5B%5B%20%24loopVar%20-ne%200%20%5D%5D%3B%0Ado%0A%20%20%20%20%20%20%20%20echo%20-n%20%22-%24loopVar-%20%22%0A%20%20%20%20%20%20%20%20data%3D%24(curl%20-s%20https%3A%2F%2Faccess.redhat.com%2Flabs%2Fsecuritydataapi%2Fcve.json%3Fpage%3D%24loopVar)%0A%20%20%20%20%20%20%20%20if%20%5B%5B%20%22%24data%22%20%3D%3D%20%22%5B%5D%22%20%5D%5D%3B%20then%0A%20%20%20%20%20%20%20%20%20%20%20%20%20%20%20%20loopVar%3D0%0A%20%20%20%20%20%20%20%20else%0A%20%20%20%20%20%20%20%20%20%20%20%20%20%20%20%20toFile%3D%24toFile%24%7Bdata%3A1%3A-1%7D%22%2C%20%22%0A%20%20%20%20%20%20%20%20%20%20%20%20%20%20%20%20let%20loopVar%3DloopVar%2B1%0A%20%20%20%20%20%20%20%20fi%0Adone%0AT%3D%22%24((%24(date%20%2B%25s)-T))%22%0Aecho%20%22%5B%24%7BtoFile%3A%3A-2%7D%5D%22%20%3E%3E%20%22%24dataDir%2FrhelCve.json%22%0Ased%20-i%20’s%2F%5E%5C%5B%5C%5D%24%2F%2Fg’%20%22%24dataDir%2FrhelCve.json%22%0Aprintf%20%22Got%20data%20in%3A%20%2502dd%3A%2502dh%3A%2502dm%3A%2502ds%5Cn%22%20%22%24((T%2F86400))%22%20%22%24((T%2F3600%2524))%22%20%22%24((T%2F60%2560))%22%20%22%24((T%2560))%22%0A” message=”Get CVE infos for RHEL” highlight=”” provider=”manual”/]


Additional information:
If you query the NIST NVD Data and search for RHEL CPEs you won’t get a lot of hits as only a smal percentage of the CVEs that affect Red Hat software has the correct CPE attached. However – NIST NVD is nice to have because in the Red Hat CVEs only the total CVSS score is listed but no detailed vulnerability metrics are included.

vCenter alarm Polling (v2) – Cross platform version (Windows & Appliance)

As it has been some time since my last post about a solution on how to get vCenter alarms to Zabbix, and VMware also evolved I followed a new approach on that topic as my initial post only supports Windows vCenters. Furthermore the solution is not as stable as I wished that it would be, so my new approach is to query all alarms from a vCenter via it’s SDK.
Initially all the alarms are discovered and created in Zabbix and in a second step the values for the discovered alarms are polled.
Currently the script used the data center object of the vCenter to discover alarms, so it can’t be used on a standalone ESXi-Server. However – if the code is changed to use whatever object is needed to get the alarms directly from the ESXi-server it should also be possible to get alarms directly from a server without the need of a vCenter (but I didn’t implement that till now as there wasn’t the need/time).

vCenter alarms – SDK (tested with ESXi 6.0+ and Zabbix 3.0 on RHEL 7)

To install the vCenter alarms the attached zip needs to be downloaded and the VMware Perl SDK must be installed on the Zabbix Server.
The template needs to be imported into Zabbix and the vCenter username and password need to be set in the username/password macros of the template.

The other two files (vcenterAlarms.pl & vcenterAlarms.wrapper) need to be extracted to the externalscripts folder of the Zabbix Server. The wrapper script is just a shell script that is executed by a Zabbix item to call the per script and send the that to Zabbix via Zabbix Sender.  As the VMware API is quite slow the wrapper also starts itself again with NOHUP because otherwise the timeout defined in the Zabbix Server configuration would cause an exit of the script. For my setup it always took longer than 30 Seconds till tall data where gathered and therefor the Zabbix Server would kill the script in the middle of the execution and no data would be sent to Zabbix. That’s why I added this workaround. Furthermore it also checks if there are less than eleven vcenterAlarms.wrapper processes running, and only starts if there are less, to ensure that Zabbix does not spawn hundreds of NOHUP-processes.