Operating an offline Certificate Authority (CA) requires meticulous management of the Certificate Revocation List (CRL), which must be periodically updated to maintain security integrity. Relying on calendar reminders to track CRL expiration is prone to human error, potentially resulting in an expired CRL that disrupts validation processes. While not critical, an expired CRL can cause operational issues and should be proactively avoided. A more robust solution is to leverage Zabbix for automated monitoring and alerting of CRL expiration dates.
To implement this, deploy the accompanying script into the externalscripts directory on your Zabbix Server or Proxy—typically located at:
/usr/lib/zabbix/externalscripts
This enables Zabbix to regularly check CRL status and send timely notifications, ensuring uninterrupted certificate validation.
#!/usr/bin/env bash

url=$1

if [ -z $url ];
then

echo "Parameter1 for URL missing!"
exit 1
fi


if [[ $(curl -s -o /dev/null -w "%{http_code}" http://pki.forensik.justiz.gv.at/ForensikRootCA.crl) -ne 200 ]];
then
echo "URL does not return a valid return-code"
exit 1
fi


timestamp=$(openssl crl -in $url -noout -nextupdate | cut -d= -f2 | xargs -I{} date -d "{}" +%s)

echo $timestamp
Template example:
<?xml version="1.0" encoding="UTF-8"?>
<zabbix_export>
<version>7.0</version>
<template_groups>
<template_group>
<uuid>d425d61f4e974282812817affe7836b2</uuid>
<name>FAWCS Templates</name>
</template_group>
</template_groups>
<templates>
<template>
<uuid>4d00efa818484e048020a73a2331c9b9</uuid>
<template>Monitor_CRL_for_next_Update</template>
<name>Monitor_CRL_for_next_Update</name>
<groups>
<group>
<name>FAWCS Templates</name>
</group>
</groups>
<items>
<item>
<uuid>b09fc8a561934a768bc100290f4832f1</uuid>
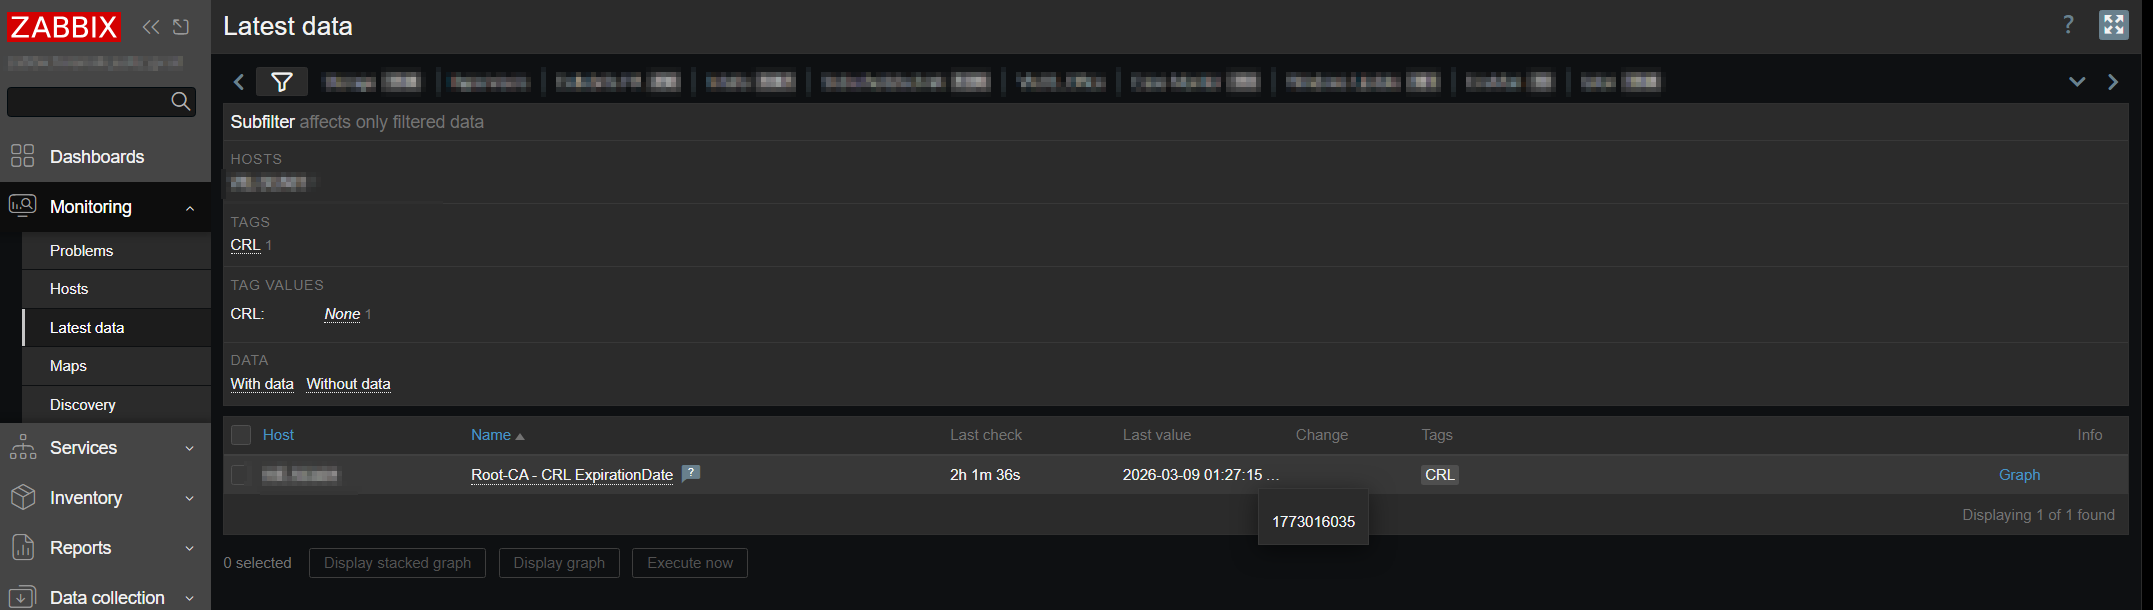
<name>Root-CA - CRL ExpirationDate</name>
<type>EXTERNAL</type>
<key>checkCRL.sh[http://address.to/your/RootCA.crl]</key>
<delay>1d</delay>
<units>unixtime</units>
<description>Uses a shell script to get the timestamp of a CRLs nextupdatedate (CRL should be a http-address</description>
<tags>
<tag>
<tag>CRL</tag>
</tag>
</tags>
<triggers>
<trigger>
<uuid>1ba5a78e5eaf4ed9b3a14d1b88321d5a</uuid>
<expression>last(/Monitor_CRL_for_next_Update/checkCRL.sh[http://address.to/your/RootCA.crl],#1)<(now()+3600*24*7)</expression>
<name>CRL Update Required in 7d</name>
<priority>DISASTER</priority>
<description>CRL needs to be updated in the next 7d!</description>
</trigger>
<trigger>
<uuid>8985748a1b9542f2879915941e36a009</uuid>
<expression>last(/Monitor_CRL_for_next_Update/checkCRL.sh[http://address.to/your/RootCA.crl],#1)<(now()+3600*24*15)</expression>
<name>CRL Update Required in 15d</name>
<priority>HIGH</priority>
<description>CRL needs to be updated in the next 15d!</description>
</trigger>
<trigger>
<uuid>85ece5ff79654f6e82b757d5e72cd143</uuid>
<expression>last(/Monitor_CRL_for_next_Update/checkCRL.sh[http://address.to/your/RootCA.crl],#1)<(now()+3600*24*30)</expression>
<name>CRL Update Required in 30d</name>
<priority>AVERAGE</priority>
<description>CRL needs to be updated in the next 30d!</description>
</trigger>
</triggers>
</item>
</items>
</template>
</templates>
</zabbix_export>